
If you caught my YouTube Short on generating presentations as React apps with an LLM, this is the prompt I promised. Paste it into Claude Code, edit the CONTENT block at the top, and you get back a single-file Presentation.jsx — five slides, keyboard nav, animated counters, an architecture diagram, a pie chart with before/after bars, the works.
The reason this prompt works (and a hundred shorter ones don't) is that it locks the design system and the narrative arc, then leaves only the content free. Same five-beat structure every time: title → conflict → intervention → proof → wisdom. Same fonts, same accent-color rules, same easing curve on every animation. The LLM doesn't get to "be creative" about the things that make decks look amateur when you let it improvise.
How to use it
- Open Claude Code in any folder.
- Paste the entire prompt below.
- Edit the
CONTENTblock at the top to match your topic — change the headlines, the three stats on slide 2, the diagram nodes, the bar chart numbers, the four lessons. Leave everything else alone. - Let it run. You'll get
Presentation.jsxback. Drop it into a Vite + React + Tailwind project, installframer-motionandrecharts, and you're done.
That's the whole loop. The first time you run it takes maybe 30 seconds of editing the content block. After that, every deck you generate looks like it came from the same studio.
The Prompt
# Build an Editorial Five-Slide Presentation
You are building a single-file React presentation component. Read this entire spec before writing any code. The deliverable is one file: `Presentation.jsx`.
## PRESENTATION CONTENT — EDIT THIS BLOCK
This is the only section that changes between decks. Fill it in, then build the presentation around it. Keep this content in a `CONTENT` constant at the top of the generated file so future edits are trivial.
```js
const CONTENT = {
meta: {
brand: "Atlas / Field Report",
author: "Jordan Park",
role: "Staff Engineer",
org: "Atlas · 2026",
accent: "#f59e0b",
},
title: {
eyebrow: "A case study in five movements",
headlineA: "Scaling",
headlineB: "Atlas.",
deck: "How a side project survived growing from {1,000} to {10,000,000} users — and what broke first.",
},
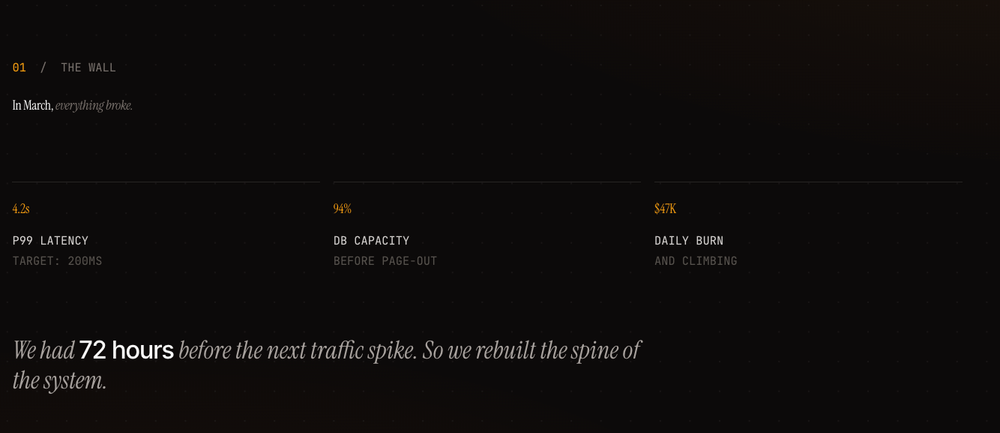
problem: {
sectionNum: "01",
sectionName: "The Wall",
headlineA: "In March,",
headlineB: "everything broke.",
stats: [
{ value: 4.2, decimals: 1, suffix: "s", label: "p99 latency", sub: "target: 200ms" },
{ value: 94, decimals: 0, suffix: "%", label: "DB capacity", sub: "before page-out" },
{ value: 47, decimals: 0, prefix: "$", suffix: "K", label: "daily burn", sub: "and climbing" },
],
closer: "We had {72 hours} before the next traffic spike. So we rebuilt the spine of the system.",
},
architecture: {
sectionNum: "02",
sectionName: "The Rebuild",
headlineA: "We replaced the monolith",
headlineB: "with seven smaller services.",
caption: "Fig. 1 · Atlas system topology, Q2 rebuild",
pulseNodeId: "gw",
nodes: [
{ id: "client", x: 80, y: 200, label: "Client", sub: "WEB · iOS" },
{ id: "cdn", x: 280, y: 200, label: "CDN", sub: "EDGE" },
{ id: "gw", x: 490, y: 200, label: "API Gateway", sub: "RATE · AUTH" },
{ id: "auth", x: 730, y: 80, label: "Auth", sub: "JWT" },
{ id: "core", x: 730, y: 200, label: "Core API", sub: "GO · 12 PODS" },
{ id: "feed", x: 730, y: 320, label: "Feed", sub: "RANK" },
{ id: "cache", x: 970, y: 130, label: "Redis", sub: "64 GB" },
{ id: "db", x: 970, y: 270, label: "Postgres", sub: "3 SHARDS" },
],
edges: [
"M 140 200 L 220 200",
"M 340 200 L 430 200",
"M 550 200 L 640 200 L 640 80 L 670 80",
"M 550 200 L 670 200",
"M 550 200 L 640 200 L 640 320 L 670 320",
"M 790 80 L 880 80 L 880 130 L 910 130",
"M 790 200 L 880 200 L 880 130 L 910 130",
"M 790 200 L 880 200 L 880 270 L 910 270",
"M 790 320 L 880 320 L 880 270 L 910 270",
],
},
results: {
sectionNum: "03",
sectionName: "The Numbers",
headlineA: "Six weeks later,",
headlineB: "the graphs told a different story.",
pie: {
title: "Traffic share / by service",
data: [
{ name: "Core API", value: 45 },
{ name: "Feed Service", value: 28 },
{ name: "Search", value: 15 },
{ name: "Auth", value: 8 },
{ name: "Other", value: 4 },
],
},
bars: {
title: "Before · After / six weeks apart",
rows: [
{ metric: "p99 latency", before: 4200, after: 180, unit: "ms", decimals: 0 },
{ metric: "DB CPU", before: 94, after: 28, unit: "%", decimals: 0 },
{ metric: "Error rate", before: 2.1, after: 0.04, unit: "%", decimals: 2 },
{ metric: "Cost / user", before: 47, after: 6, unit: "¢", decimals: 0 },
],
},
},
takeaways: {
sectionNum: "04",
sectionName: "Field Notes",
headlineA: "What we'd tell ourselves",
headlineB: "eighteen months ago.",
closer: "End of transmission · thank you",
lessons: [
{ num: "01", title: "Measure before you optimize.",
body: "We were certain the database was the bottleneck. It was the cache-key serializer. Profile first — your intuition is wrong more often than you think." },
{ num: "02", title: "Boring tech wins.",
body: "We replaced our distributed event bus with Postgres LISTEN/NOTIFY. Half the moving parts, none of the 3 AM pages." },
{ num: "03", title: "Decouple services, not teams.",
body: "A microservice maintained by two engineers isn't a service — it's a deployment liability waiting for someone to quit." },
{ num: "04", title: "Cache aggressively. Invalidate carefully.",
body: "A 99.9% hit rate masked a critical race condition for three months. Then, one Tuesday afternoon, it didn't." },
],
},
};
```
## NARRATIVE STRUCTURE — DO NOT DEVIATE
Every deck follows this five-beat arc. When the user provides a different topic, map their content into these beats; do not invent extra slides or skip any.
1. **Title** — name the work, hint at the journey
2. **The conflict** — three quantified pain points that frame the stakes
3. **The intervention** — a diagram of the new system, process, or approach
4. **The proof** — quantitative results: one composition chart + before/after deltas
5. **The wisdom** — four short lessons in your own voice
This shape works for engineering retros, product launches, research findings, market analysis, postmortems, founder updates — anything where you're walking an audience from problem to insight.
## DESIGN SYSTEM — LOCKED
**Colors (all on dark background):**
- Background: `#0c0a09` (stone-950)
- Foreground: `#fafaf9` (stone-50)
- Muted text: `#a8a29e` (stone-400), `#78716c` (stone-500), `#57534e` (stone-600)
- Hairlines: `#292524` (stone-800), `#44403c` (stone-700)
- Accent: read from `CONTENT.meta.accent` — used sparingly for one word per headline, key stats, and the active progress pip
**Fonts (load via Google Fonts in a `<style>` block):**
- `Instrument Serif` — display, both roman and italic
- `JetBrains Mono` — all uppercase tracking labels, metadata, captions
- `Inter Tight` — body copy, button labels
**Headline pattern (used on slides 2–5):** Two-part headline where the first half is roman in foreground color and the second half is *italic* in muted stone-500. Both parts animate up from `y: 20` on a stagger.
**Typography sizes:**
- Hero title: `clamp(96px, 12vw, 200px)` leading-[0.88]
- Section headlines: `clamp(52px, 6vw, 84px)` leading-[1]
- Stat counters: `clamp(72px, 8.4vw, 120px)`
- Section eyebrow + chrome labels: `14px`, tracking-[0.32em], uppercase, monospace
- Body: `18px` leading-[1.65]
- Sub-labels in diagram: `11px` mono, letterSpacing 1.5
**Atmosphere layer:** Behind every slide, render two fixed elements:
1. A radial gradient: amber glow top-right (6% opacity) and bottom-left (4%)
2. A dot-grid background: `radial-gradient(rgba(245,245,244,0.04) 1px, transparent 1px)`, `36px × 36px`, opacity 0.35
**Chrome (persistent across all slides):**
- Top-left: 10px accent dot + brand name in mono caps
- Top-right: current section name (animates in/out on slide change)
- Bottom-left: progress pips — active pip is 44px wide and accent-colored; inactive pips are 18px wide and stone-700. All are 3px tall.
- Bottom-right: page counter formatted `01 — 05` in mono caps
- Bottom-center, slide 1 only: animated "→ press arrow keys to advance" hint
## ANIMATION SYSTEM
Use **framer-motion** only. Every animation uses the same easing curve: `const EASE = [0.22, 1, 0.36, 1]`.
**Slide transitions:** Use `AnimatePresence mode="wait"` with a directional slide. Define variants:
```js
const variants = {
enter: (dir) => ({ x: dir > 0 ? 80 : -80, opacity: 0 }),
center: { x: 0, opacity: 1 },
exit: (dir) => ({ x: dir > 0 ? -80 : 80, opacity: 0 }),
};
```
Duration: 0.7s. Track direction in state as `[page, direction]`.
**Per-slide entrance choreography:**
1. **0.2s** — eyebrow / section number fades in
2. **0.35–0.6s** — headline parts slide up on a 0.15s stagger
3. **0.8–1.0s** — primary content begins entering on a stagger
4. **1.5–1.8s** — secondary details, captions, closing lines
Specific required animations:
- **Counters** count up from zero using `requestAnimationFrame`, eased with `1 - (1-p)^4`. Implement as a reusable `<Counter>` component.
- **Architecture diagram** edges draw on via `pathLength: 0 → 1`. Nodes fade in *after* their incoming edge. Add one pulsing concentric ring on the `pulseNodeId` node.
- **Bar chart** bars grow via `width: 0% → x%`. "After" bar starts 0.25s after "Before". Numeric labels count up in sync.
- **Pie chart** uses Recharts with `isAnimationActive`, `animationBegin: 1000`, `animationDuration: 1200`.
## KEYBOARD & NAVIGATION
- `→` / `Space` / `PageDown` — advance
- `←` / `PageUp` — previous
- `Home` / `End` — jump to first / last
- Clicking a progress pip jumps to that slide
- Slides remount on entry (use `key={page}`) so animations replay every visit
## TECHNICAL REQUIREMENTS
- **Single file**, default-exported React component
- Imports: `react`, `framer-motion`, `recharts`
- Styling: Tailwind utility classes + a single `<style>` block for Google Fonts and four custom font-family classes (`.ff-display`, `.ff-display-italic`, `.ff-tech`, `.ff-body`) plus a `.tab-nums` utility
- Full-viewport: `w-screen h-screen overflow-hidden`
- Use `tabular-nums` on every animating number
- The `{curly brace}` syntax in prose strings should be parsed into a small inline-render helper that renders the wrapped text in foreground color within an otherwise muted paragraph.
## DELIVERABLE
Write the complete file to `Presentation.jsx`. Do not split into multiple files. Do not output a partial implementation and ask whether to continue — produce the whole thing in one pass.A few notes if you want to tweak it
- Change the accent color in
CONTENT.meta.accentto anything you like — emerald, rose, sky, whatever fits the topic. The whole deck rebalances around it. - The five-beat arc is doing a lot of the heavy lifting. If your topic doesn't have a "conflict / intervention / proof" shape, the deck will feel forced. Save this prompt for content that genuinely has a before-and-after.
- Use the
{curly braces}in prose to highlight stats inline. It's a small touch but it's what makes the body copy feel designed instead of dumped.
If you make something cool with this, send it my way — I want to see how far it stretches.